


Abstract
Recent JWST/NIRCam imaging taken for the ultra-deep UNCOVER program reveals a very red dropout object at zphot ≃ 7.6, triply imaged by the galaxy cluster A2744 (zd = 0.308). All three images are very compact, i.e., unresolved, with a delensed size upper limit of re ≲ 35 pc. The images have apparent magnitudes of mF444W ∼ 25−26 AB, and the magnification-corrected absolute UV magnitude of the source is MUV,1450 = −16.81 ± 0.09. From the sum of observed fluxes and from a spectral energy distribution (SED) analysis, we obtain estimates of the bolometric luminosities of the source of Lbol ≳ 1043 erg s−1 and Lbol ∼ 1044–1046 erg s−1, respectively. Based on its compact, point-like appearance, its position in color–color space, and the SED analysis, we tentatively conclude that this object is a UV-faint dust-obscured quasar-like object, i.e., an active galactic nucleus at high redshift. We also discuss other alternative origins for the object's emission features, including a massive star cluster, Population III, supermassive, or dark stars, or a direct-collapse black hole. Although populations of red galaxies at similar photometric redshifts have been detected with JWST, this object is unique in that its high-redshift nature is corroborated geometrically by lensing, that it is unresolved despite being magnified—and thus intrinsically even more compact—and that it occupies notably distinct regions in both size–luminosity and color–color space. Planned UNCOVER JWST/NIRSpec observations, scheduled in Cycle 1, will enable a more detailed analysis of this object.
Export citation and abstract BibTeX RIS

Original content from this work may be used under the terms of the Creative Commons Attribution 4.0 licence. Any further distribution of this work must maintain attribution to the author(s) and the title of the work, journal citation and DOI.
1. Introduction
Quasars, or quasi-stellar objects, are extremely luminous objects powered by supermassive black holes (SMBH) in their centers. Accretion onto the SMBH transfers a large amount of potential energy from the infalling matter, as well as kinetic energy due to friction, into thermal energy, which in turn results in a very high luminosity (typical bolometric luminosities of Lbol ∼ 1044–1048 erg s−1; see, e.g., Shen et al. 2020).
While quasars are known in relatively large numbers throughout the Universe and especially out to z ∼ 6 (e.g., Bañados et al. 2016; Lyke et al. 2020; Flesch 2021), only several quasars are known at high-redshifts z ≳ 7, albeit with increasing numbers (e.g., Bañados et al. 2018; Wang et al. 2018; Yang et al. 2021). Nevertheless, the formation and evolution of these high-redshift SMBHs, observed when the Universe was less than 1 Gyr old, is poorly understood, as the accretion rate onto them, or alternatively their initial masses, seem largely prohibited by common formation scenarios (e.g., Volonteri 2012; Fan et al. 2019, and references therein; though see also Trakhtenbrot et al. 2017). Moreover, while the quasar luminosity function (LF) implies a larger abundance of fainter objects (i.e., faint end slopes of ∼1.2–1.6; e.g., Glikman et al. 2011; Niida et al. 2020) similar to the galaxy LF, faint quasars with MUV ≳ −22 seem to be rare in observations. Indeed, the JWST (Gardner et al. 2006; McElwain et al. 2023), launched one year ago, may help in finding more such objects. Recent work suggests that active galactic nuclei (AGNs) that are excessively massive relative to their host galaxies, accreting at high Eddington rates, would be detectable with JWST at high redshifts (Volonteri et al. 2023) and potentially shed light on early black hole growth.
The last decade has seen many hundreds of high-redshift objects detected with the Hubble Space Telescope (HST) and with several ground-based surveys such as UltraVISTA (McCracken et al. 2012) or LAGER (Zheng et al. 2017), for example. It has by now become well established that the Universe was reionized in the first billion years, i.e., by redshift z ∼ 5.5–6 (e.g., Fan et al. 2006; Stark et al. 2010; Pentericci et al. 2011; Robertson et al. 2015; Planck Collaboration et al. 2016; Bosman et al. 2022). However, it is not yet clear if early galaxies supply sufficient ionizing radiation to account for reionization or if a major contribution from quasars or other exotic sources (e.g., supermassive stars, X-ray binaries, etc.) is needed. The shape of the galaxy ultraviolet (UV) LF at high redshifts implies that most of the ionizing radiation originated from the more abundant population of faint galaxies (e.g., Atek et al. 2015a), but these have been largely beyond the reach of HST. It is also not clear if the LF already shows a turnover at HST depth, even in the deepest lensed fields (e.g., Atek et al. 2015a; Bouwens et al. 2017), although a tentative turnover may have been detected (Atek et al. 2018; Bouwens et al. 2022). One of the main goals of the JWST is to study the first stars and galaxies. In combination with the power of gravitational lensing, we will indeed be able to address some of these key questions, as can already be implied by the first six months of JWST operations (e.g., Adams et al. 2023; Atek et al. 2023; Bouwens et al. 2023; Castellano et al. 2023; Donnan et al. 2023; Finkelstein et al. 2023; Furtak et al. 2023b; Morishita et al. 2023).
Another crucial ingredient to understanding the epoch of cosmic reionization (EoR) is the spectrum of high-redshift galaxies. Some of the highest-redshift objects spectroscopically confirmed from the ground (Oesch et al. 2015; Zitrin et al. 2015; Roberts-Borsani et al. 2016; Stark et al. 2017) seem to hint at a harder UV spectrum than expected from typical stellar populations (Stark et al. 2015a, 2015b), indicating possible AGN activity, Population III star contribution, or other hard ionizing photon sources (e.g., Laporte et al. 2017; Mainali et al. 2017; Matthee et al. 2020). Observations with the JWST have already supplied unprecedented rest-frame UV and optical spectra for some very high-redshift galaxies (Roberts-Borsani et al. 2023; Curtis-Lake et al. 2023; Williams et al. 2023) and might indeed supply new insight soon. In addition, objects that potentially bridge the typical high-redshift galaxy and AGN populations were also recently reported. Fujimoto et al. (2022) found a dusty MUV,1450 ≃ −23.2 compact object bridging galaxies and quasars in the EoR. Its spectral energy distribution (SED) was distinct from typical high-redshift galaxies but could be well explained by the combination of a dusty star-forming galaxy SED and that of a quasar (see also Cui et al. 2021; Matthee 2021 for discussion of AGNs and high-redshift galaxy colors). The Fujimoto et al. (2022) galaxy is faint in X-rays, indicating the emergence of a uniquely UV-compact star-forming region or a Compton-thick super-Eddington black hole accretion disk at the dusty starburst core. Additionally, Endsley et al. (2023a) reported a heavily obscured hyperluminous AGN at z = 6.85 that was originally identified as very dusty Lyman-break z ≃ 7 galaxy with strong far-infrared (FIR) and radio emission (Endsley et al. 2022). As another example, Onoue et al. (2023) have recently detected a faint (MUV,1450 ≃ −19.5), relatively low-mass AGN candidate at z ∼ 5 in the JWST Cosmic Evolution Early Release Science Survey program (CEERS; Bagley et al. 2023; Finkelstein et al. 2023), based on its compact shape and red spectrum, which can be attributed to the redshifted rest-frame optical Hβ and [O iii] and Hα emission lines. Since then, several high-redshift (z ∼ 4−9) AGNs have been discovered and spectroscopically confirmed in the CEERS field (Akins et al. 2023; Harikane et al. 2023; Kocevski et al. 2023; Larson et al. 2023; Yang et al. 2023) as well as another possible type of red source, a quiescent galaxy at z ∼ 5 (Carnall et al. 2023).
In this work, we highlight the discovery a very compact high-redshift (z ≳ 7) object that is triply imaged by the galaxy cluster A2744 (zd = 0.308) in recent JWST imaging. Two of the multiple images of this system were originally found by Atek et al. (2014) in Hubble Frontier Fields (HFF; Lotz et al. 2017) data. The new JWST imaging now allows us to secure the third counter image and hint at the peculiar nature of this object: they accentuate the compact, potentially point-source-like nature of the source, and reveal a SED with very red shape toward the longer wavelengths. The size, colors, and SED fits of this object thus suggest that it is not a typical high-redshift galaxy. Rather, its properties suggest either an ultra-faint, dust-obscured high-redshift quasar (or an object in transition between a normal high-redshift galaxy and an AGN-dominated one), or potentially an even more exotic compact object such as a clump of Population III, supermassive, or dark stars, or a direct-collapse black hole (DCBH), which we consider here as well. It is worth noting that we use here the term "quasar" in the simplest sense of an object with a quasi-stellar appearance, and in lenient alternation with "AGN," i.e., designating an object with a strong AGN contribution.
This paper is organized as follows: In Section 2, we describe the data used in this work. In Sections 3 and 4, we report the discovery of the object and discuss its physical properties. The work is concluded in Section 5. Throughout this paper, we use a standard flat ΛCDM cosmology with H0 = 70 km s−1 Mpc−1, ΩΛ = 0.7, and Ωm = 0.3. Magnitudes quoted are in the AB system (Oke & Gunn 1983) and all quoted uncertainties represent 1σ ranges unless stated otherwise.
2. Data
The main data set used in this work are the recent observations taken with the Near Infrared Camera (NIRCam; Rieke et al. 2005, 2023) aboard JWST, carried out in the framework of the Ultra-deep NIRSpec and NIRCam ObserVations before the Epoch of Reionization (UNCOVER) program (Program ID: GO 02561; PIs: I. Labbé & R. Bezanson; Bezanson et al. 2022). The JWST UNCOVER program was designed to observe the strong lensing (SL) galaxy cluster A2744 with NIRCam to unprecedented depths in the F115W, F150W, F200W, F277W, F356W, F410M, and F444W bands and over a large area of ∼45 arcmin2 around the cluster. A2744 has also recently been observed in two other JWST programs: the early release (ERS) survey GLASS-JWST (Program ID: ERS 1324; PI: T. Treu; Treu et al. 2022) and a director's discretionary time (DDT) program targeting a lensed supernova (Program ID: DD 2756; PI: P. Kelly). The NIRCam imaging from these programs is also folded into the UNCOVER mosaics used in this work. The data were reduced and drizzled into mosaics with the Grism redshift and line analysis software for space-based spectroscopy (grizli;
30
Brammer et al. 2022). The final mosaics used here have pixel scales of 0 02 and 004 in the short- and long-wavelength channels (SW and LW), respectively, and sum up ∼16 hr exposure time per filter on average, achieving 5σ depths of 29–30 AB magnitudes, or ∼32 AB with lensing magnification. A photometric catalog of objects detected in the whole UNCOVER field is also generated in the UNCOVER program and is released with its other data products (Weaver et al. 2023). The catalog includes photometric redshift estimates for each identified object and lists the lensing magnifications from the UNCOVER lensing model (Furtak et al. 2023c), which is described in more detail in Section 3.4. We refer the reader to Bezanson et al. (2022) and Weaver et al. (2023) for more details of the data reduction, field depth in the different bands, source extraction, and catalog assembly. All UNCOVER data products are publicly available on the UNCOVER website.
31
02 and 004 in the short- and long-wavelength channels (SW and LW), respectively, and sum up ∼16 hr exposure time per filter on average, achieving 5σ depths of 29–30 AB magnitudes, or ∼32 AB with lensing magnification. A photometric catalog of objects detected in the whole UNCOVER field is also generated in the UNCOVER program and is released with its other data products (Weaver et al. 2023). The catalog includes photometric redshift estimates for each identified object and lists the lensing magnifications from the UNCOVER lensing model (Furtak et al. 2023c), which is described in more detail in Section 3.4. We refer the reader to Bezanson et al. (2022) and Weaver et al. (2023) for more details of the data reduction, field depth in the different bands, source extraction, and catalog assembly. All UNCOVER data products are publicly available on the UNCOVER website.
31
We note that the GLASS-JWST program also obtained Near-Infrared Imager and Slitless Spectrograph (NIRISS; Doyon et al. 2012, R. Doyon et al. 2023, in preparation) spectroscopy of the cluster core covering wavelengths λ ∼ 1.1–2.2 μm. The UNCOVER program also includes spectroscopic follow-up observations with JWST's Near Infrared Spectrograph (NIRSpec; Ferruit et al. 2022; Jakobsen et al. 2022; Böker et al. 2023), which are scheduled for 2023 July and would allow deeper spectroscopic measurements and to longer wavelengths. A2744 will also be observed with NIRCam as part of the JWST guaranteed time observation (GTO) program Prime Extragalactic Areas for Reionization and Lensing Science (PEARLS; Program ID: GTO 1176; PI: R. Windhorst; Windhorst et al. 2023).
Ancillary data for A2744 include deep (∼29 AB) HST imaging, taken in various programs, most prominently the HFF and HST grism spectroscopy from the Grism Lens-Amplified Survey from Space survey (GLASS; PI: T. Treu; Treu et al. 2015). We also note that spectroscopy with the Multi-Unit Spectroscopic Explorer (MUSE; Bacon et al. 2010) on ESO's Very Large Telescope (VLT) was used to measure the redshift for many multiply imaged galaxies in the cluster (Mahler et al. 2018; Bergamini et al. 2023). A2744 is also part of the ALMA Frontier Fields survey (González-López et al. 2017; Kohno 2019; Sun et al. 2022) with the Atacama Large Millimeter/submillimeter Array (ALMA), the band 6 (λ ∼ 1.2 mm) imaging of which is also used in this work. Finally, A2744 has various X-ray observations (see, e.g., Merten et al. 2011; Bogdan et al. 2023), which are publicly available on the Chandra Data Archive and which we use to search for X-ray counterparts of the red object.
3. A Triply Imaged Compact Object at zphot ≃ 7.6
We construct a composite-color image from the UNCOVER NIRCam mosaics including the previous programs mentioned in Section 2. Three distinct red point-like objects stand out in the central core of the cluster (see Figure 1). These follow the lensing symmetry observed for other lensed systems, and our lens model (Furtak et al. 2023c) indeed predicts these to be counter images of the same object at a high redshift, namely zmodel ≳ 7 (but see Section 3.4 for more details). Two of the images reported here were in fact already designated as high-redshift z ∼ 7–8 multiple-image candidates by Atek et al. (2014, 2015b) in the HFF data (see also Lam et al. 2014) and were included in the Mahler et al. (2018) SL model of A2744. The recent JWST data now not only allow us to detect the third counter image but also reveal the peculiar properties of this source. In the following, we review the observed and physical properties of the red object and discuss its possible origins.
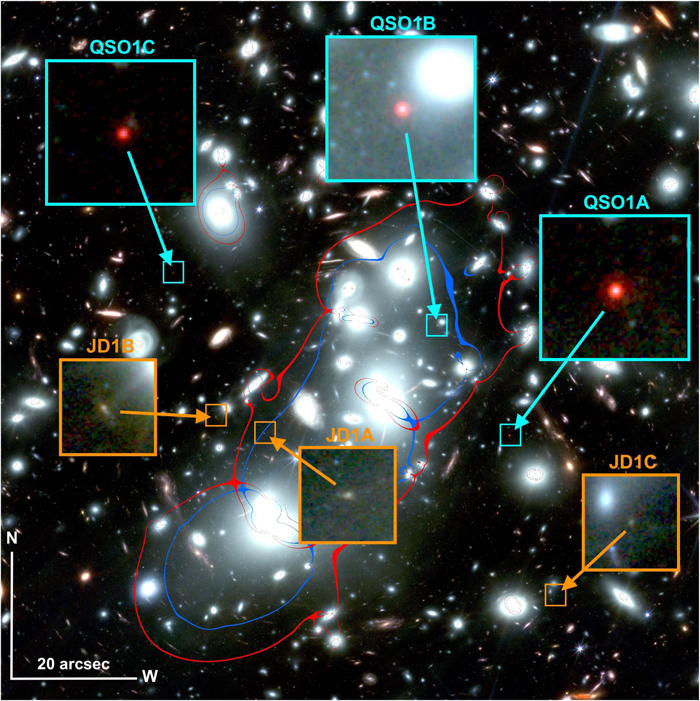
Figure 1. JWST/NIRCam composite-color image of A2744 (blue: F115W+F150W, green: F200W+F277W, red: F356W+F410W+F444W; see Figure 4 in Furtak et al. 2023c for a larger field of view) together with the critical curves from our SL model for sources at zs = 1.69 (blue) and zs = 7.5 (red). The notable three point-like red multiple images in cyan squares are the images (and zoomed-in versions) of the quasar candidate reported here at a redshift of zphot ≃ 7.6. We refer to these as QSO1A, B, and C. For comparison, we also show the three images (JD1A, B, and candidate C image) of the Zitrin et al. (2014) z ≃ 9.76 object recently confirmed in Roberts-Borsani et al. (2023) with JWST spectroscopy, in orange squares. All squares in the figure encompass about 24 × 24, and a 20'' bar is given in the bottom left corner. We note that, despite being at a lower redshift than JD, the faint quasar candidate is significantly redder. Also, the images of JD1 show significant structure, whereas the images of our object are point-like, implying a very compact demagnified size of re
< 35 pc, at most. The SED of the red object is shown in Figures 4 and 5.
Download figure:
Standard image High-resolution image3.1. Photometry
The three images of our object are detected in the UNCOVER catalog (for details, see Weaver et al. 2023). The detection is performed on the UNCOVER mosaics corrected for intracluster light (ICL) with the Python implementation of SExtractor (SEP; Bertin & Arnouts 1996; Barbary 2016, 2018). We note, however, that for images B and C, the UNCOVER catalog fluxes are heavily contaminated with light from the nearby cluster galaxy in image B (see Figure 1) and from a faint blue object right next to image C (also visible in Figure 1). In order to derive decontaminated fluxes for these two images, we measure them in a circular aperture of 032 diameter using photutils (v1.6.0; Bradley et al. 2022) and subtract a local background measured in an annulus around the aperture. The background annuli are carefully optimized to not oversubtract the background in image B and to exclude the blue neighboring object in image C. The fluxes are then aperture corrected using the point-spread function (PSF) in each band. For consistency, we compare the fluxes of image A measured with our method to the UNCOVER catalogs results and find that they concur well. The photometry of all three images used in this work is listed in Table 1. The flux ratios of images B and C to image A are slightly systematically lower than—but broadly consistent with—the magnification ratios predicted by the lens model (see Section 3.4). Some color discrepancies are seen, in particular in image B which we note may still contain residual ICL contamination. However, we find that these discrepancies are below the expected systematics from the background estimation, probed by examining different background annuli. Therefore, we can only conclude that the colors and flux levels of the images are broadly consistent, also with the lens model prediction, but do not at this stage detect a significant color variation between the three images.
Table 1. Photometry of the Three Multiple Images of the Red Compact Object
| ID | R.A. | Decl. | F435W | F606W | F814W | F105W | F115W | F125W | F140W | F150W | F160W | F200W | F277W | F356W | F410W | F444W | ALMA Band 6 | μ |
|---|---|---|---|---|---|---|---|---|---|---|---|---|---|---|---|---|---|---|
| Image A (8296) | 00:14:19.161 | −30:24:05.664 | <4 | <2 | <2 | 16 ± 2 | 22 ± 2 | 23 ± 3 | 26 ± 3 | 24 ± 2 | 32 ± 3 | 28 ± 2 | 32 ± 1 | 167 ± 1 | 283 ± 3 | 359 ± 2 | <85.5 × 10³ | 7.5 ± 0.4 |
| Image B (9992) | 00:14:20.051 | −30:23:48.058 | <4 | <2 | <2 | 18 ± 2 | 20 ± 2 | 26 ± 2 | 22 ± 3 | 27 ± 3 | 22 ± 3 | 29 ± 3 | 35 ± 2 | 130 ± 1 | 212 ± 1 | 262 ± 1 | <85.5 × 10³ | 8.4 ± 0.8 |
| Image C (10712) | 00:14:23.331 | −30:23:39.639 | <4 | <2 | <2 | 5 ± 1 | 8 ± 1 | 9 ± 1 | 7 ± 1 | 10 ± 1 | 6 ± 1 | 9 ± 1 | 12 ± 1 | 49 ± 1 | 79 ± 1 | 98 ± 1 | <67.7 × 10³ | 4.0 ± 0.1 |
Notes. Fluxes are in nanojanskys from the deep HST/Advanced Camera for Surveys (ACS), HST/Wide-Field Camera Three (WFC3), and JWST/NIRCam imaging. For image A, fluxes are taken from the UNCOVER photometric catalog (032 apertures; Weaver et al. 2023). For images B and C, which are near a cluster galaxy and a foreground blue galaxy, respectively, we use a dedicated PSF-corrected aperture photometry measurements. It should be noted that fluxes listed here are not yet corrected for magnification. For each of the three images, we also indicate the catalog ID number in parentheses. For bands in which the images are not detected, we list the 1σ upper limit. The magnifications are computed from our UNCOVER-based SL model of A2744 published in Furtak et al. (2023c).
Download table as: ASCIITypeset image
The UNCOVER catalog also contains a first photometric redshift estimate of  computed with EAZY (Brammer et al. 2008). This agrees with the high-redshift geometric estimate from our lens model (see Section 3.4). We note, however, that EAZY does not yield a good fit for this object (e.g., χ2 = 462 for image A). This is due to the extremely red colors that this object has in the JWST filters (see Section 3.2), which cannot be properly reproduced with the standard template set used with EAZY for the UNCOVER catalogs (unless a combination of several galaxy templates are used), and hints at its peculiar nature. We note that AGN templates are not included in the EAZY run.
While this object is covered by the GLASS-JWST NIRISS observations (see Section 2), none of the three images is detected spectroscopically. This is not surprising, however, since the three images are relatively faint (∼28 AB magnitudes) in the λ ∼ 1.1–2.2 μm range covered with NIRISS. The strong emission in the redder bands F356W, F410M, and F444W (down to ∼25 AB) will, however, be picked up in the planned UNCOVER JWST/NIRSpec observations, which will reach 5σ continuum depths of 28–29 AB magnitudes. These correspond to limiting 3−4σ emission-line sensitivities of  in the F444W band, assuming an intrinsic line width of 500 km s−1 at z = 7.6 computed with the JWST/NIRSpec exposure time calculator (ETC).
We also note that the object is not detected in the ALMA data (see Table 1 for upper limits and Section 2 for details), nor do we observe any counterparts in the 1.25 Ms of recently acquired Chandra X-ray data (Bogdan et al. 2023).
3.2. Colors
The object appears to be very red, with NIRCam colors, in magnitudes:
At z ∼ 7.5–8, the Hβ and [O iii] lines are shifted into the F410M and F444W bands, whereas the [O ii] doublet is shifted into the F356W band, which may account for the very red colors. Indeed, these lines have been observed to be sufficiently strong to modify and boost the broadband colors of galaxies. In fact, they have also been used as indicators for possible Lyα emitters (LAEs) in the EoR (e.g., Labbé et al. 2013; Smit et al. 2015; Roberts-Borsani et al. 2016; Stark et al. 2017). However, the NIRCam colors that we find here seem to be much redder than expected for typical early galaxies at z ∼ 7−8. In Figure 2, we show color–color diagrams demonstrating that our red object is indeed extreme: it clearly falls outside the region in which typical galaxies found at similar redshifts with JWST reside (Endsley et al. 2022b) and in the direction that suggests higher emission lines, dust extinction, and/or a strong Balmer break. For comparison, Endsley et al. (2022b) have found that one red galaxy in their z ∼ 7−8 sample (Figure 14 in Endsley et al. 2022b; see also Labbé et al. 2023) can also be explained explained by a combination of a galaxy with an AGN, resulting in an [O iii]+Hβ equivalent width (EW) of over 5000 Å. Our object has even more extreme colors and can thus be expected to either have even stronger emission lines, which might suggest an AGN component or an extremely red and dusty rest-frame optical continuum. Both scenarios will be further discussed in the following sections. We note that our object is also significantly redder than the red galaxy population detected by Labbé et al. (2023) at higher redshifts (also shown in Figure 2).
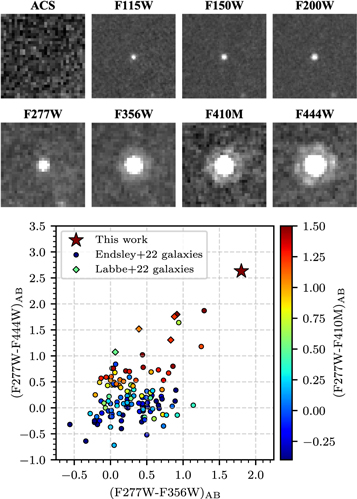
Figure 2. Upper panel: Our red compact object in the different JWST/NIRCam bands taken with UNCOVER. The upper left panel shows a stack of the HFF ACS that shows a clear nondetection. Each square is 12 × 12. We show here the data for the first multiple image (image A). Bottom panel: Color–color diagram of our object (star) with typical NIRCam-detected z ∼ 7−8 galaxies (Endsley et al. 2022b; circles) and red z ∼ 9 galaxies (Finkelstein et al. 2023; Labbé et al. 2023; squares) in the CEERS field. The source presented in this work is redder by about a magnitude compared to the reddest of the CEERS sources, which hints at heavy emission-line activity or a very strong and dusty rest-frame optical continuum.
Download figure:
Standard image High-resolution image3.3. Spectral Slopes
We fit the continuum of our object with a power law Fλ ∝ λβ . The UV continuum is estimated in the rest-frame 1300–2300 Å range (i.e., the F115W through F200W bands) and we obtain a UV slope of βUV = −1.6 ± 0.2.
For comparison, the UV slope of our object is somewhat bluer than that of a red quasar, such as, for example, the z ∼ 7 object found by Fujimoto et al. (2022), but typical of unobscured AGNs (e.g., Vanden Berk et al. 2001; Selsing et al. 2016). This slope is also of the same order as other high-redshift galaxies with similar absolute UV luminosities (Bouwens et al. 2014). It is, however, notably redder than typical early galaxies recently detected in JWST observations (e.g., Adams et al. 2023; Atek et al. 2023; Castellano et al. 2023; Cullen et al. 2023; Furtak et al. 2023b; see also discussion in Endsley et al. 2022b), or the population of galaxies at high redshifts with blue UV slopes but red rest-frame optical colors mentioned above (Finkelstein et al. 2023; Labbé et al. 2023).
We also estimate the optical continuum slope, in the rest-frame 3200–5100 Å range (F277W through F444W). We find a much redder optical slope of βoptical = 1.89 ± 0.04 compared to the UV slope, in line with the extremely red colors seen for this object toward longer wavelengths.
3.4. Lensing Magnifications and Geometric Redshift
To estimate the delensed properties of the object presented here as well as to corroborate the photometric redshift estimates, we use an updated fully parametric SL model of A2744 that we recently constructed in the framework of the UNCOVER program (Furtak et al. 2023c; see also Roberts-Borsani et al. 2023). The model uses a long list of spectroscopically confirmed multiply imaged systems (e.g., Mahler et al. 2018; Bergamini et al. 2023) and additional photometric systems identified in the new UNCOVER data, in particular in the two northern subclusters. We note that this substructure only has a minor effect on the SL properties in the main cluster core though, where the object studied in this work is situated. For the lens model, cluster galaxies are each modeled as a dual pseudo-isothermal elliptical mass distribution (dPIE; see Keeton 2001; Elíasdóttir et al. 2007) and five dark matter (DM) halos are used, each modeled as a pseudo-isothermal elliptical mass distribution (PIEMD; e.g., Keeton 2001). The final model used in this work reproduces the >60 multiple-image systems, which span a wide redshift range from z ∼ 1.7 to z ≃ 10 very well with a lens plane rms of 066. Full details of the model are given in Furtak et al. (2023c). The critical curves from the model for various redshifts can be seen in Figure 1.
We use this SL model to obtain magnifications of μ = 7.5 ± 0.4, μ = 8.4 ± 0.8, and μ = 4.0 ± 0.1 for images A, B, and C, respectively, assuming a source redshift of zs ∼ 7.5. These are in broad agreement with the flux ratios that we measure for the three objects (see Table 1).
We can also use the SL model to examine the redshift of the source, due to the nesting effect in which the lensing critical curves grow for higher source redshifts. However, as the angular diameter distance ratio saturates for high-redshift sources, a concrete redshift estimate is not easy to obtain, but a lower limit can be placed. In particular, our model from Furtak et al. (2023c) strongly suggests that the object lies at z > 7 and in fact pushes to even higher redshifts around z ∼ 10–11 (although these higher redshifts are ruled out by the photometry). To further examine this, we therefore generate a suite of different models spanning a larger range of input configurations (i.e., number of DM halos, number of freely weighted massive cluster galaxies, number of photometric multiply imaged systems, and multiple-image configurations). These models explicitly include the red object system with a free redshift to be optimized and also two new dropout systems at zphot ≃ 4.9 and zphot ≃ 6.9 identified in the UNCOVER data close to the images of the red object. The various resulting models span a range of best-fit redshift estimates for the red object system, with the lowest-redshift ones being z ∼ 5.5. A similar constraint can in fact be also obtained model-independently from the geometry of multiple-image systems near the red object: Systems up to z ∼ 5 are seen as expected at somewhat smaller angles than the red object, implying that the red object system should lie at a higher redshift.
3.5. Luminosity
Extrapolating the fitted UV continuum to 1450 Å, we measure a relatively faint UV luminosity of MUV,1450 = −16.81 ± 0.09 after correcting for gravitational magnification.
We furthermore compute a lower limit estimate of the bolometric luminosity by integrating the broadband photometry in all available bands (see Table 1) over their respective bandwidths, which yields Lbol > 2 × 1043 erg s−1 after magnification correction. We note that this only constitutes a lower limit on the bolometric luminosity, because our measurements only span the rest-frame UV and optical spectral ranges. Another estimate for the bolometric luminosity is given in Section 3.8, based on the SED fit.
Finally, the ALMA nondetection of our object results in an upper limit on the rest-frame infrared (IR) luminosity of LIR < 2 × 10¹⁰ L⊙ at 1σ, assuming a single modified blackbody with a dust temperature Td = 47 K and a dust-emissivity spectral index βd = 1.6 (Beelen et al. 2006) scaled to the ALMA nondetection as in, e.g., Furtak et al. (2023a).
3.6. Size
We verify that the source is indeed an unresolved point source with a dedicated GALFIT (Peng et al. 2010) analysis in all available filters. From the GALFIT measurement, we obtain an observed effective radius of re
≃ 1.3 pixels (with a pixel scale of 002 pixel−1) in the SW bands for both of the images that are not heavily affected by a nearby cluster galaxy light (i.e., images A and C; see Figure 1 and Section 3.1), and re
< 1 pixel in the LW bands. The typical statistical error for these fits in both the SW and LW channels is ≲0.05 respective pixels. Taking the magnification into account, this size estimate translates into a source radius upper limit of re
≲ 100 pc. Moreover, we note that both image A and image C have a very similar effective radius fit of re
≃ 1.3 pixels. However, by the magnification ratio, we would expect image A to have a 40% larger radius if the images were even marginally resolved. This suggests that, indeed, the object is an unresolved point source.
Given the point-like nature of the source, assuming a PSF with a FWHM of 004 for the shortest-wavelength filter and taking the magnification into account, we place an upper limit of FHWM ≲70 pc on the source. The relation between the FWHM and effective radius is not straightforward and depends on the light profile shape of the source (Voigt & Bridle 2010; Ryon et al. 2017). For simplicity, we here assume the effective radius re
to be half of the FWHM. It should be noted that this is somewhat conservative; e.g., for an exponential disk, the factor is higher,  (Murphy et al. 2017). We thus obtain an upper limit on the source size of re
≲ 35 pc.
(Murphy et al. 2017). We thus obtain an upper limit on the source size of re
≲ 35 pc.
This limits the possible nature of the source somewhat, by largely ruling out a massive and extended evolved galaxy in which the red colors would originate from stellar continuum alone. Instead, if the emission of our object is indeed dominated by starlight, it would need to be a bright and dense clump of stars (see also discussion in Section 4). These are, however, usually close to a host galaxy, which is clearly not observed here. Indeed, the sizes of lensed high-redshift galaxies measured with HST imply very small re ∼ 100 pc scale upper limits (e.g., Coe et al. 2013; Zitrin et al. 2014; Bouwens et al. 2017; Kawamata et al. 2018). The scenario in which only a bright clump from a distant galaxy is seen, i.e., the host galaxy is below the detection limit, therefore needs to be considered. Observations of high-redshift galaxies with JWST have already revealed them to show substructures consistent with multiple star-forming clumps, as, e.g., in the multiply imaged z ∼ 10 object in A2744 (Zitrin et al. 2014; Roberts-Borsani et al. 2023) shown in Figure 1 or in the z ∼ 10 object recently observed by Hsiao et al. (2023). With the JWST UNCOVER data, which are much deeper than other JWST images so far, and despite the relatively high lensing magnification (see Table 1), we do not find any hint of an underlying more extended structure to our object. This implies that the measured luminosity may indeed arrive from a single central source with a size on the scale of at most several tens of pc.
3.7. Luminosity Density
In Figure 3, we put the UV luminosity measured in Section 3.5 in relation to our source-size upper limit measured in Section 3.6. The red compact object studied here seems to have a very high UV luminosity density, occupying a different region of the size–luminosity diagram than most typical galaxies both at high and low redshifts. In particular, it is smaller by about an order of magnitude than the smallest of these galaxies. This implies that it may indeed be too bright for its size to be explained by regular stars alone. For reference, our object has a UV luminosity density of at least an order of magnitude higher than most of the Labbé et al. (2023) red high-redshift galaxies and of similar order as the very brightest (MUV ∼ −24) and most compact (re ∼ 300 pc) low-redshift UV emitters. Bearing in mind that the object is not a transient source, e.g., it was already detected in the HFF (see also our discussion of time delays in Section 4), only a few possible scenarios remain. For example, the main engine driving the observed luminosity and colors could possibly be a faint and dust-obscured AGN such as in, for example, Fujimoto et al. (2022) or one of the objects in Endsley et al. (2022b), or possibly a more exotic source such as a compact clump of Population III or supermassive stars (although the object does not seem to show colors blue enough to support the former, as discussed in Section 4). While the current data set in absence of spectroscopy does not allow a robust discussion of the possible scenarios, we nevertheless perform an SED analysis in Section 3.8, showing that the AGN scenario is plausible. A more detailed source analysis is deferred to future work when the planned UNCOVER JWST/NIRSpec observations are available (scheduled for 2023 July; Bezanson et al. 2022).
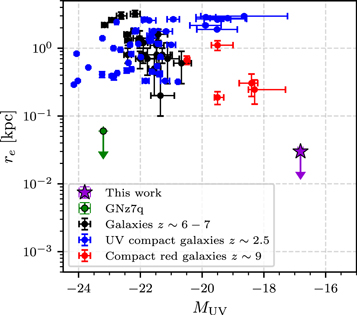
Figure 3. MUV–size diagram. Our red compact object is shown as the purple star. For comparison, we also show typical compact UV-emitting galaxies at both low redshifts (from Barro et al. 2014; blue dots) and high redshifts (from Bowler et al. 2017; black dots). We also show red galaxies recently detected with JWST in the CEERS field by both Labbé et al. (2023) and Finkelstein et al. (2023). Our red object is more compact by about an order of magnitude compared to the smallest of these galaxies. Also shown in green is an obscured quasar, or a hybrid galaxy–AGN candidate, GNz7q, recently detected by Fujimoto et al. (2022).
Download figure:
Standard image High-resolution image3.8. SED Fitting
In order to further investigate the origin of the object's observed properties and to constrain its parameters, we perform several SED fits to the demagnified photometry of image A (see Table 1), using the BayEsian Analysis of GaLaxy sEds tool (BEAGLE; Chevallard & Charlot 2016), Prospector (Johnson et al. 2021), and the Code Investigating GALaxy Emission (CIGALE; Boquien et al. 2019; Yang et al. 2020, 2022). We first fit our object with a star-forming galaxy in Section 3.8.1 and then add an AGN component in Section 3.8.2. Finally, we fit a custom model of an obscured AGN SED in Section 3.8.3.
3.8.1. Galaxy SED Fits
For the galaxy SED fit with BEAGLE, we follow Endsley et al. (2022b), i.e., we adopt log-uniform priors on stellar mass (![$\mathrm{log}({M}_{\star }/{M}_{\odot })\in [5,12]$](https://content.cld.iop.org/journals/0004-637X/952/2/142/revision1/apjacdc9dieqn4.gif) ), age (
), age (![$\mathrm{log}({t}_{\mathrm{age}}/\mathrm{yr})\in [6,{t}_{\mathrm{Universe}}]$](https://content.cld.iop.org/journals/0004-637X/952/2/142/revision1/apjacdc9dieqn5.gif) ), metallicity (
), metallicity (![$\mathrm{log}(Z/{Z}_{\odot })\in [-2.2,-0.3]$](https://content.cld.iop.org/journals/0004-637X/952/2/142/revision1/apjacdc9dieqn6.gif) ), and galaxy-wide effective ionization parameter (
), and galaxy-wide effective ionization parameter (![$\mathrm{log}(\hat{U})\in [-4,-1]$](https://content.cld.iop.org/journals/0004-637X/952/2/142/revision1/apjacdc9dieqn7.gif) ). The dust-to-metal mass ratio is fixed to ξd = 0.3, and we adopt a uniform prior on the effective V-band dust attenuation optical depth of
). The dust-to-metal mass ratio is fixed to ξd = 0.3, and we adopt a uniform prior on the effective V-band dust attenuation optical depth of ![${\hat{\tau }}_{V}\in [0.001,5]$](https://content.cld.iop.org/journals/0004-637X/952/2/142/revision1/apjacdc9dieqn8.gif) . We use the standard Gutkin et al. (2016) set of BEAGLE templates, which combine the latest version of the Bruzual & Charlot (2003) stellar population models with Cloudy (Ferland et al. 2013) photoionization models to account for nebular emission. We assume a Chabrier initial stellar mass function (IMF; Chabrier 2003), a constant star-forming history (SFH) and an SMC dust attenuation law (Pei 1992), and account for intergalactic medium (IGM) attenuation using the Inoue et al. (2014) IGM models.
. We use the standard Gutkin et al. (2016) set of BEAGLE templates, which combine the latest version of the Bruzual & Charlot (2003) stellar population models with Cloudy (Ferland et al. 2013) photoionization models to account for nebular emission. We assume a Chabrier initial stellar mass function (IMF; Chabrier 2003), a constant star-forming history (SFH) and an SMC dust attenuation law (Pei 1992), and account for intergalactic medium (IGM) attenuation using the Inoue et al. (2014) IGM models.
This fit is complemented with an independent galaxy SED fit with Prospector (Johnson et al. 2021). In particular, we use Prospector-α, which models a nonparametric SFH and assumes a continuity prior to ensure smooth transitions between time bins (Leja et al. 2017, 2019). We additionally include two priors on the stellar mass and the SFH from Wang et al. (2023). The stellar mass prior is constructed from the observed mass functions in Leja et al. (2020), and the dynamic SFH prior is a simple phenomenological description reflecting the consistent observational finding that massive galaxies form much earlier than low-mass galaxies (Cowie et al. 1996; Thomas et al. 2005). The Prospector fit assumes a Charlot & Fall (2000) dust attenuation in this work.
Both best-fitting galaxy SEDs are presented in Figure 4. They both consistently find a very well-constrained photometric redshift of zphot ∼ 7.6–7.7, i.e., somewhat higher than the EAZY-derived redshift from the UNCOVER catalog (see Section 3.1). Both codes also find extremely large stellar masses of order  because they produce the measured red optical colors of our object (see Section 3.2) with mostly stellar continuum. Such a massive galaxy is, however, very unlikely given the extremely compact nature of the source of re
≲ 35 pc (see Section 3.6): the resulting stellar mass density would exceed the densest known globular clusters by orders of magnitude. A more likely scenario, for example, could therefore be that the red optical colors are also driven by powerful nebular emission lines rather than stellar continuum alone, as investigated in Section 3.8.2. In addition, both galaxy SED fits seem to require large dust attenuations to produce the red optical continuum. The reader should bear in mind, though, that we do not detect any dust continuum emission in the ALMA 1.2 mm imaging at <85 μJy (see Table 1), the AV
= 6.4 ± 0.5 found by Prospector in particular is not consistent with the upper limit on the IR luminosity estimated in Section 3.5, and the AV
∼ 2 found by the BEAGLE fit is only marginally consistent.
because they produce the measured red optical colors of our object (see Section 3.2) with mostly stellar continuum. Such a massive galaxy is, however, very unlikely given the extremely compact nature of the source of re
≲ 35 pc (see Section 3.6): the resulting stellar mass density would exceed the densest known globular clusters by orders of magnitude. A more likely scenario, for example, could therefore be that the red optical colors are also driven by powerful nebular emission lines rather than stellar continuum alone, as investigated in Section 3.8.2. In addition, both galaxy SED fits seem to require large dust attenuations to produce the red optical continuum. The reader should bear in mind, though, that we do not detect any dust continuum emission in the ALMA 1.2 mm imaging at <85 μJy (see Table 1), the AV
= 6.4 ± 0.5 found by Prospector in particular is not consistent with the upper limit on the IR luminosity estimated in Section 3.5, and the AV
∼ 2 found by the BEAGLE fit is only marginally consistent.

Figure 4. Maximum a posteriori (MAP; i.e., best-fit) galaxy SEDs fitted with BEAGLE and Prospector (black). The demagnified photometry of image A is shown in blue, and the marginal model fluxes in each band calculated from the posterior distribution are shown in red. Left: BEAGLE SED fit with a constant SFH star-forming galaxy. Right: Prospector SED fit with a nonparametric SFH star-forming galaxy. Both fits consistently find our object to lie at a redshift of zphot ∼ 7.6–7.7. The expected position of the rest-frame optical [O iii]λ5007 Å and Hβ lines at the best-fit photometric redshift are indicated in green. Also noted on the figures are the resulting physical parameters and reduced χ2 values.
Download figure:
Standard image High-resolution image3.8.2. Galaxy+AGN SED Fits
We use two codes that can also combine AGN emission models with that of the galaxy component: BEAGLE-AGN (Vidal-García et al. 2022), which includes type II AGN templates (Feltre et al. 2016) incorporated into BEAGLE by E. Curtis-Lake to add AGN narrow-line emission to the galaxy templates; and CIGALE, which also accommodates a type I AGN, which we a priori expect to be the most consistent with the object's compact morphology (see Section 3.6). For the BEAGLE-AGN fit, we adopt a similar configuration and parameter space as in Section 3.8.1, again following Endsley et al. (2022b). For the CIGALE fit, we follow the configuration of Yang et al. (2023), assuming a delayed SFH, the Bruzual & Charlot (2003) stellar population models with a Chabrier IMF and stellar metallicity Z = 0.02 Z⊙, nebular emission models by Villa-Vélez et al. (2021), a modified Calzetti et al. (2000) dust attenuation law (Leitherer et al. 2002), the Draine et al. (2014) dust emission models for the host galaxy, the Skirtor2016 (Stalevski et al. 2012, 2016) 3D radiative transfer AGN models, which account for the AGN emission from the far UV to the torus and polar dust emission in the IR, and the Meiksin (2006) IGM attenuation models. We refer the reader to Boquien et al. (2019) and Yang et al. (2020) for more details of the CIGALE templates used here. The AGN component in CIGALE can be of type I or type II, as determined through the inclination angle, which we keep as a free parameter to allow for both options. Because CIGALE includes dust emission models, we also include the ALMA nondetection (see Table 1) as an upper limit in this fit.
The best-fitting SEDs of both galaxy+AGN fits are shown in Figure 5. Both fits yield photometric redshifts of zphot ∼ 7.6−7.7, consistent with the previous results, and seem to much better reproduce the observed photometry (reduced χ2 = 5.65 and χ2 = 4.47 for the BEAGLE-AGN and CIGALE fits, respectively) than the galaxy-only fits presented in Section 3.8.1. The two AGN fits also yield lower dust attenuations than the galaxy-only fits (see Figure 4), which are now more consistent with the ALMA nondetection.
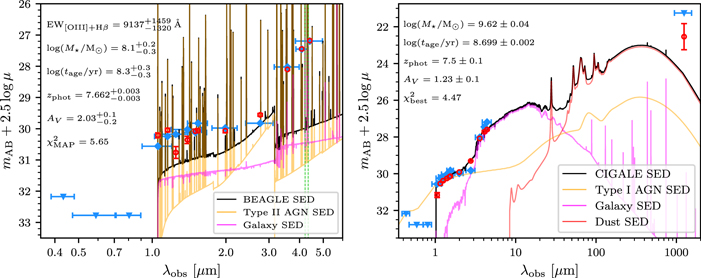
Figure 5. Maximum a posteriori (MAP) AGN SEDs fitted with BEAGLE-AGN and CIGALE (black). The demagnified photometry of image A is shown in blue, and the marginal fluxes in each band, computed from the posterior distribution, are shown in red as in Figure 4. Left: BEAGLE-AGN SED fit with a star-forming galaxy and a type II AGN, similar to Endsley et al. (2022b). The expected position of the rest-frame optical [O iii]λ5007 Å and Hβ lines at the best-fit photometric redshift are indicated in green. Right: CIGALE SED fit with the combination of a galaxy with a type I AGN and a dust emission component. We decompose the best-fitting SEDs (black) into their individual components, the galaxy SED (purple), the AGN emission (orange), and the dust emission (red). The galaxy+AGN fits seems to better reproduce the observed red colors and red UV slope (see Section 3.2) than the galaxy-only fits shown in Figure 4. This is also consistent with the luminosity density of our source described in Sections 3.6 and 3.7. Also noted on the figures are the resulting physical parameters and reduced χ2 values. In the right-hand panel, the best-fit CIGALE SED (black) includes IGM attenuation while the individual components do not.
Download figure:
Standard image High-resolution imageAssuming a covering fraction of 10% by the narrow-line emitting gas, from the BEAGLE-AGN fit we find an accretion luminosity of  . The CIGALE fit yields a lower accretion luminosity of
  . Integrating the entire best-fitting AGN SEDs over their full wavelength range (i.e., from rest-frame 0.005 μm to 255 μm for BEAGLE-AGN and from rest-frame 0.001 μm to 1 × 10⁶
μm for CIGALE), we find bolometric luminosities of Lbol ≃ 1044 erg s−1 for both the type I and type II AGN, complementing the measurement in Section 3.5.
. Integrating the entire best-fitting AGN SEDs over their full wavelength range (i.e., from rest-frame 0.005 μm to 255 μm for BEAGLE-AGN and from rest-frame 0.001 μm to 1 × 10⁶
μm for CIGALE), we find bolometric luminosities of Lbol ≃ 1044 erg s−1 for both the type I and type II AGN, complementing the measurement in Section 3.5.
The solution from CIGALE, which suggests a type I AGN component, provides officially the better fit to the photometry among the two. In this fit, the UV continuum is dominated by the AGN component and the optical colors are produced by a very steep red stellar continuum (right-hand panel of Figure 5). This solution again requires a very large stellar mass of  . In comparison, the BEAGLE-AGN fit yields a lower stellar mass (
 ), and instead reproduces the red colors in the LW filters with extremely strong nebular emission powered by the type II AGN component (
![${\mathrm{EW}}_{[{\rm{O}}\,\mathrm{III}]+{\rm{H}}\beta }={9137}_{-1320}^{+1459}$](https://content.cld.iop.org/journals/0004-637X/952/2/142/revision1/apjacdc9dieqn14.gif) Å). In that respect, one should note that most rest-frame UV emission lines predicted by the latter fit (black curve in the left-hand panel of Figure 5) are likely too weak—i.e., with magnified integrated fluxes F < 1 × 10⁻¹⁸ erg s−1 cm−2—to be detected in the GLASS-JWST NIRISS grism observations (see Section 2 and Treu et al. 2022) according to the JWST/NIRISS ETC. Hence, their nondetection does not currently help to discriminate between the two cases.
Å). In that respect, one should note that most rest-frame UV emission lines predicted by the latter fit (black curve in the left-hand panel of Figure 5) are likely too weak—i.e., with magnified integrated fluxes F < 1 × 10⁻¹⁸ erg s−1 cm−2—to be detected in the GLASS-JWST NIRISS grism observations (see Section 2 and Treu et al. 2022) according to the JWST/NIRISS ETC. Hence, their nondetection does not currently help to discriminate between the two cases.
It is also important to note that, in the presented SED fits, the extremely strong rest-frame optical [O iii] and Hβ lines fall exactly onto the edge of the F410M and F444W bands, which is also the reason for the seemingly very precise photometric redshift estimate (see Figures 4 and 5). This is due to the fact that the LW bands have a much higher signal-to-noise ratio than the other filters (see Table 1) and thus dominate the fit. We therefore run another set of BEAGLE tests assuming a minimum uncertainty of 5% in each band. We do not show these explicitly here, but we note that the resulting fits, in particular the BEAGLE-AGN fit, are only marginally different. While in this 5% minimum-error test the galaxy-only fit (see Section 3.8.1) technically has a slightly lower χ2 than the BEAGLE-AGN fit shown here, it also predicts an extremely large stellar mass of ∼1010 M⊙, similar to but somewhat higher than the mass implied by the CIGALE fit, and a dust attenuation of AV ≃ 5. These are, however, disfavored due to the considerations of mass density and the ALMA nondetection, as already discussed in Section 3.8.1.
3.8.3. AGN-only SED Fit
As shown in the previous Sections 3.8.1 and 3.8.2, the combined galaxy and AGN SED fits suggest that the rest-frame UV part of the SED is best accounted for by a type I AGN, and the red optical part is governed by a contribution from either emission lines or stellar continuum. However, none of these provides a very likely fit to the object's photometry. The red optical part requires an underlying stellar component that is too massive given the object's size, and it also predicts an ALMA detection that is not observed. Furthermore, the extreme emission-line solution requires significant contribution from nebular continuum, which results in a much redder UV slope than observed. This might suggest that the object could in fact be AGN-dominated in both the rest-frame UV and optical regimes, which could be the case if we were looking at a heavily dust-obscured type I AGN where the red continuum stems from the AGN-heated dust, the relatively faint blue continuum comes from scattered UV light, and the host galaxy does not contribute significantly at all (e.g., Glikman et al. 2013, 2023; Banerji et al. 2015; Assef et al. 2016).
We therefore perform an additional SED fit using a compound model based on stacked Sloan Digital Sky Survey (e.g., Stoughton et al. 2002) type I QSOs (Vanden Berk et al. 2001) complemented with the Glikman et al. (2006) template at longer wavelengths. The model has two components: a reddened component that represents a moderately dust-obscured (AV ∼ 3−5) type I AGN, and a nonreddened component that represents the scattered light of the QSO (typically <1 % of the red component's bolometric luminosity). The reddened component is generated by applying dust attenuation to the type 1 QSO template above, integrating the absorbed flux, and re-emitting it in the IR using the AGN dust emission prescription implemented in Prospector, which is described in detail in Leja et al. (2018). This model was inspired by the NIRCam and NIRSpec observations of a similar yet less extreme, i.e., bluer and low-redshift, source in the CEERS program (Kocevski et al. 2023) and manages to reproduce its emission lines very well (see Labbé et al. 2023). The primary fit parameters of this simple obscured AGN model are the bolometric luminosity and the dust attenuation.
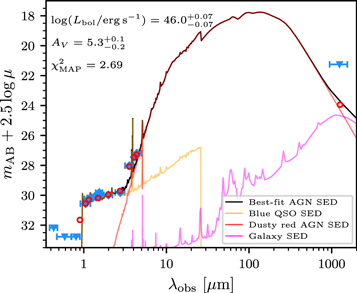
The best-fitting SED with this model is shown in Figure 6. It manages to reproduce at the same time both the rest-frame UV and optical photometry of the source. As expected, the host galaxy does not contribute to the total photometry, meaning that the object is entirely dominated by the AGN. In addition, and unlike the galaxy-only SEDs presented in Section 3.8.1, this scenario is consistent with the compact nature of our object (see Section 3.6), its low UV luminosity (see Section 3.5), and the ALMA nondetection. The latter is because the dust would be warmer and its continuum therefore would peak at lower wavelengths than the λ ∼ 1.2 mm observed in ALMA Band 6, as can be seen in Figure 6. The best-fitting SED therefore has a relatively high dust attenuation of  , and the resulting bolometric luminosity of Lbol ≃ 1046 erg s−1 is higher by two orders of magnitude than in the fits presented in Section 3.8.2.
Figure 6. Maximum a posteriori (MAP) obscured AGN SED (black). As in Figures 4 and 5, the measured and marginal photometries are shown in blue and red, respectively. We decompose the best-fit SED into its reddened QSO component (red) and the scattered light that makes up the rest-frame UV component of the SED (orange). The contribution of the host galaxy is marginal and shown in purple. Because the dust in this scenario is warmer than in a typical dusty star-forming galaxy (see Figure 4), its emission peaks at lower wavelengths than the λ ∼ 1.2 mm probed by our ALMA Band 6 measurement, such that the substantial dust attenuation necessary to fit the LW bands is nonetheless consistent with the ALMA nondetection.
Download figure:
Standard image High-resolution image
It should be acknowledged that, because we do not probe specifically such a combination here, at this point it is unclear if we could differentiate between the above scenario, in which the red optical part comes from the reddened type I QSO and the blue UV part comes from scattered, unreddened UV light of the QSO, and a scenario in which the blue light comes from a low-mass unobscured star formation as in Akins et al. (2023). We defer further SED analysis of this object to future work.
This two-component AGN-only fit is the best among all different SED fits tried in this work, and we thus adopt it as the most probable scenario. We therefore conclude that this triply imaged source is most likely a highly dust-obscured red quasar.
4. Discussion
Given the SED-fitting results and the other properties of this object described in Section 3, we tentatively conclude that this triply imaged, red compact object is most probably a UV-faint dust-obscured AGN at high redshift, as presented in Section 3.8.3. While throughout this study our primary candidate engine for the underlying emission of our object is a UV-faint dust-obscured AGN, or an intense and possibly dust-obscured star-forming clump—which albeit less likely should perhaps not be completely ruled out—we also briefly discuss in this section other possible candidates.
The first generations of stars to have formed in the Universe, i.e., Population III stars, are expected to have been very poor in metals, massive (>10 M⊙), energetic, and short-lived (e.g., Zackrisson et al. 2011, and references therein), and may have contributed significantly to the cosmic reionization. The red colors that we measure (see Section 3.2), which could also be indicative of strong nebular emission lines as mentioned several times in this work, are however in disagreement with the colors expected for Population III galaxies (see Zackrisson et al. 2011). In addition, Population III stars are expected to show strong Balmer lines but only weak lines of heavier elements such as [O iii], which would be in tension with the extremely high [O iii]+Hβ EWs suggested by some of our SED-fitting analysis (Section 3.8). We note, however, that the latter does not contain Population III templates, and it would have difficulties fitting such a population, as discussed in detail in, e.g., Furtak et al. (2023b). The UV continuum slope expected for Population III galaxies is also significantly bluer than our measurements (Section 3.2), and we thus conclude that the emission of our object is likely not of Population III origin.
Supermassive stars, with masses above 103 M⊙, are a population of stars put forward to explain chemical abundances in globular clusters (e.g., Gieles et al. 2018; Martins et al. 2020, and references therein). Given that they should reside in star clusters and are expected to have a nontypical spectral shape compared to "regular" stars, such as strong Balmer emission lines (as well as other emission or absorption properties that depend on temperature), we briefly consider them here as well. Indeed, the colors measured for the red object could possibly fit the predicted colors of supermassive stars (for example, see the F115W − F200W versus F200W − F444W colors shown in Figure 15 in Martins et al. 2020). Supermassive stars should therefore possibly be considered as a viable candidate population that is not ruled out currently.
Dark stars are hypothesized stellar objects that are powered by DM annihilation, rather than atomic fusion (Freese et al. 2016). They are formed at about 1 M⊙ but can grow through accretion to large masses above >106 M⊙ and luminosities >1010 L⊙, essentially becoming (some sort of) supermassive stars, such that they—if they exist—could be detected with the JWST. However, we find that the red colors we measure for our object are substantially redder than what is expected for these hypothetical dark stars (see Figure 6 in Freese et al. 2016).
A Population III hypernova is an ultraenergetic supernova of a Population III star, typically with a mass of few M⊙ and peak bolometric luminosity of a several 1046 L⊙ (Smidt et al. 2014). As these are expected in the early Universe (every few years in an early bright galaxy (e.g., Padmanabhan & Loeb 2022)) and are bright enough, they are worth considering as well. However, the time delays from our lens model (Section 3.4) suggest that the arrival time of QSO1C is about ∼19 yr prior to QSO1A, and QSO1A arrives about ∼3 yr prior to QSO1B, which is last to arrive. The total time delay between images C and B is thus about 22 yr. Because the light curves of supernovae, including hypernovae, only last several months (e.g., Smidt et al. 2014), we can exclude this as a likely option even at z ∼ 8. In general, any transient event with a source time span smaller than 22 yr divided by (1 + z) can be excluded.
DCBHs are hypothesized black holes that are formed via a direct collapse of a primordial gas halo, rather than via stellar remnants, leading to black holes of about 105 M⊙ (e.g., Bromm & Loeb 2003; Begelman et al. 2006; Ferrara et al. 2014). DCBHs are of particular interest here because they are expected to have a redder SED than typical AGN (e.g., Pacucci et al. 2016). Interestingly, our red object does indeed agree with the colors expected from DCBHs, suggesting in that framework a black hole seed mass of nearly 105 M⊙ (see Figure 4 in Pacucci et al. 2016; based on the F444W − HF160W and F356W−HF160W colors that we adopt as approximate alternatives to the ∼4.5 μm − HF160W and ∼3.6 μm − HF160W colors shown therein).
Out of these more exotic objects considered above, it seems that, based on the colors and on time delay arguments, only supermassive stars and DCBHs remain viable options in addition to the more common interpretations of an AGN or a red or extreme emission-line clump (or very compact galaxy), which were extensively discussed in Section 3. While indeed intriguing, our goal here is mainly to present the object, and while awaiting future spectra, we defer a more detailed analysis of these more exotic options to future work. A further investigation of this object will be possible once the UNCOVER NIRSpec observations become available by 2023 July. Given its relative brightness in the LW bands (mF444W ∼ 25−26 AB; see Table 1), our object should be easily detectable with the planned UNCOVER JWST/NIRSpec observations (for setup details, see Bezanson et al. 2022). These observations will enable us to disentangle the contributions of rest-frame optical continuum and emission lines and thus allow us to infer the true nature of the source. We note that, if confirmed with spectroscopy, this would make this object comparable in distance to the highest-redshift AGNs or candidates known to date (e.g., Wang et al. 2021; Larson et al. 2023) and add to the small number of AGNs that are known to be multiply imaged by galaxy clusters (e.g., Inada et al. 2003; Oguri et al. 2013; Sharon et al. 2017; Acebron et al. 2022a, 2022b). It will also constitute one of the UV-faintest AGN-dominated objects ever observed.
It should also be noted that the object is situated at redshift similar to that of the well-known high-redshift proto-cluster behind A2744 (e.g., Zheng et al. 2014), which was recently confirmed with JWST spectroscopy at z = 7.89 (Morishita et al. 2023). Deprojecting our object's position using our lens model, we find that it would lie only ∼200 kpc away from the overdensity if it were at the same redshift, which is possible given the known uncertainties and systematics of photometric redshift estimates.
5. Conclusion
We present a unique, extremely red and compact object at zphot ≃ 7.6 that is triply imaged by the SL galaxy cluster A2744. The object was detected in recent deep multiband JWST/NIRCam imaging taken for the UNCOVER program, and its high-redshift nature is independently supported geometrically by the gravitational lensing (with a lower limit of zgeo ≳ 5.5).
Thanks to the lens magnification, we can limit the size of this object at z ≃ 7.6 to re ≲ 35 pc, suggesting that it is extremely compact. We measure for this object a rather red UV continuum slope of βUV = −1.6 ± 0.2 and a relatively faint UV luminosity of MUV,1450 = −16.81 ± 0.09, yet a high bolometric luminosity (≳1043 erg s−1 and ∼1044–1046 erg s−1, respectively, from the sum of observed fluxes and from the SED fits). Our object resides in significantly different locations on both color–color and MUV–size diagrams than the regions typically occupied by star-forming galaxies or the red high-redshift galaxy populations recently revealed with the JWST. Its compact size, UV slope, extremely red rest-frame optical colors, and luminosity density suggest that the emission might possibly be assisted—or dominated—by an AGN component.
We use various codes to fit the photometry with different galaxy, galaxy+AGN, and AGN-only templates. From the galaxy-only fits, a dusty red galaxy SED matches the photometry reasonably well, although given the nondetection in dust continuum with ALMA band 6, this solution is somewhat disfavored. The addition of an AGN component improves the fit further, and while a type II AGN fit with extreme emission lines yields a reasonable fit as well, the best galaxy+AGN fit suggests a type I AGN that dominates the UV continuum, in combination with a massive, red galaxy component that dominates the rest-frame optical. These galaxy+AGN fits, however, do not seem to perfectly match the observed SED either. The best match to the data is finally provided by a two-component AGN-only fit, implying a heavily dust-obscured ( ) AGN in which the rest-frame optical red continuum comes from reddened nuclear emission, i.e., warm dust emission powered by the AGN, and the bluer continuum in the rest-frame UV comes from unobscured, scattered light from the AGN that escapes to the observer (or potentially from low-mass unobscured star formation).
In addition to the AGN and galaxy interpretations, we also discuss other candidates such as, for example, a compact clump of Population III, dark, or supermassive stars, as well as DCBHs. The predicted colors of Population III or dark stars, however, do not seem to agree with the observed colors and strong emission lines needed to explain them, whereas the predicted colors of supermassive star populations, and that of DCBHs, would agree with the observations and could therefore perhaps be considered an alternative scenario to the AGN. Spectroscopic observations planned for the next year with JWST/NIRSpec will be crucial for shedding light on the true nature of this unique source. If confirmed as an AGN at z = 7.6, this object would be one of the most distant and faintest quasar-like objects observed to date, and the most distant known gravitationally lensed AGN.
Acknowledgments
The authors would like to thank the anonymous referee for providing very useful comments, which greatly helped to improve the paper. L.F. thanks Pierre Boldrini for very useful discussions about high-redshift star clusters. A.Z. thanks Erik Zackrisson for a useful discussion regarding Population III stars. L.F. and A.Z. acknowledge support by grant No. 2020750 from the United States–Israel Binational Science Foundation (BSF) and grant No. 2109066 from the United States National Science Foundation (NSF), and by the Ministry of Science & Technology, Israel. R.B. acknowledges support from the Research Corporation for Scientific Advancement (RCSA) Cottrell Scholar Award ID No.: 27587. E.C.L. acknowledges the support of an STFC Webb Fellowship (ST/W001438/1). H.A. acknowledges support from CNES (Centre National d'Etudes Spatiales). J.C. acknowledges funding from the "FirstGalaxies" Advanced Grant from the European Research Council (ERC) under the European Union's Horizon 2020 research and innovation program (grant agreement No. 789056). P.D. acknowledges support from the NWO grant No. 016.VIDI.189.162 ("ODIN") and from the European Commission's and University of Groningen's CO-FUND Rosalind Franklin program. The work of C.C.W. is supported by NOIRLab, which is managed by the Association of Universities for Research in Astronomy (AURA) under a cooperative agreement with the National Science Foundation. The Cosmic Dawn Center (DAWN) is funded by the Danish National Research Foundation (DNRF) under grant #140. Support for the program JWST-GO-02561 was provided through a grant from the STScI under NASA contract NAS 5-03127. Cloud-based data processing and file storage for this work is provided by the AWS Cloud Credits for Research program.
This work is based on observations made with the NASA/ESA/CSA JWST and with the NASA/ESA Hubble Space Telescope (HST). The data were obtained from the Barbara A. Mikulski Archive for Space Telescopes (MAST) at the Space Telescope Science Institute (STScI), which is operated by the Association of Universities for Research in Astronomy (AURA), Inc., under NASA contract NAS 5-03127 for JWST. These observations are associated with the JWST-GO program number 2561, JWST ERS program number 1324, JWST DD program number 2756 and HST GO programs 9722, 10493, 10793, and 12101. The specific observations used in this work can be accessed via doi:10.17909/nftp-e621. This paper also makes use of the following ALMA data: ADS/JAO.ALMA#2018.1.00035.L and 2013.1.00999.S. ALMA is a partnership of ESO (representing its member states), NSF (USA) and NINS (Japan), together with NRC (Canada), MOST and ASIAA (Taiwan), and KASI (Republic of Korea), in cooperation with the Republic of Chile. The Joint ALMA Observatory is operated by ESO, AUI/NRAO and NAOJ. The National Radio Astronomy Observatory is a facility of the National Science Foundation operated under cooperative agreement by Associated Universities, Inc. This research has also made use of data obtained from the Chandra Data Archive.
This research made use of Astropy, 32 a community-developed core python package for Astronomy (Astropy Collaboration et al. 2013; Price-Whelan et al. 2018) as well as the packages NumPy (van der Walt et al. 2011), SciPy (Virtanen et al. 2020), Matplotlib (Hunter 2007), and the MAAT Astronomy and Astrophysics tools for MATLAB (Ofek 2014).
Footnotes
- 30
- 31
- 32